Table of Contents
- Introduction
- What is eBPF?
- Let’s try the eBPF Challenge
- Capturing the Flag
- Conclusion
Introduction
Hi, I’m Chihiro from the Threat Detection and Response team! Since joining Mercari, Inc. last July, I have been focused on detection engineering for cloud environments, incident response, and development of our own SOAR (Security Orchestration Automation and Response) platform.
Mercari has an official system to support club activities (Bukatsu 部活), and there are various club activities that we can participate in. Lately, I have been taking part in CTF (Capture the Flag) cyber security competitions as part of our club activity. In this blog, I would like to explain how an eBPF program is structured and processed, using as an example a reverse engineering challenge related to eBPF that was interesting for me in a CTF that I have participated in recently.
What is eBPF?
eBPF is a technology designed to run in the Linux kernel space, it is used for packet filtering and tracing and can aid in investigating performance issues. eBPF is indirectly utilized by many projects under the Cloud Native Computing Foundation (CNCF) such as Cilium (a container network interface) and Falco (a container runtime security tool).
eBPF bytecode has a unique instruction set as it is executed sandboxed on a special virtual machine. As a result of this, eBPF bytecode is based on an instruction set that is different from the normal operating system. I will explain the instruction set below but for more information, please refer to the official eBPF Instruction Set documentation.
In general, any programming language has areas to store computed values. In the case of eBPF’s virtual machine there are small-scale memory areas called registers to store computed values. These include 10 general purpose registers:
- R0: Stores a return value of a function, and exit value for an eBPF program
- R1 – R5: Stores function arguments
- R6 – R9: For general purpose usage
- R10: Stores an address for stack frame
Let’s check out the instructions below. The eBPF instructions have fixed length, similar to the instructions in RISC architecture. An instruction is 64 bits in length. More specifically, the instruction consists of the parts shown below:

Opcode specifies the instructions to be performed. There are various instructions such as moving a value to a destination register, arithmetic operations, and conditional branches. The opcode field consists of smaller parts to represent these specific instructions. The value to be assigned is stored in the Immediate field.
Take a look at the example below. It shows the 64 bit value that represents the instructions to be performed. Please note that the value is written by little-endian so that the left part is lower byte.
b7 01 00 00 44 04 05 1cThe value b7 in the first section is Opcode, and it can be converted into binary as 1011 0111. The lower 3 bits are 111, which represent an instruction such as BPF_ALU64.
The first 4 bits, 1011 are defined as BPF_MOV on BPF_ALU64. This is an instruction to copy the data from the source register to the destination register. The remaining fourth bit represents if the source is used by a register or 32-bit immediate value. If this value is 0, an immediate value is used for the source.
For the second byte, we can represent the value as 0000 0001 in binary. The binary is split into two parts, which are the source register and the destination register. In this example, the destination register is 1 which is the R1 register, and the source register is the R0 register.
However, as we previously stated, the source is an immediate value instead of a register. Therefore, we can take in the instruction that is storing an immediate value, 0x1c050444 to the R1 register.
Let’s try the eBPF Challenge
This challenge is a beginner-friendly reverse engineering challenge from Backdoor CTF. Backdoor CTF has been held since 2013 according to CTFtime.
CTFs involve solving a variety of challenges related to computer science and cyber security. The goal of each challenge is to obtain a flag, which is typically formatted as FLAG{COOL_FLAG_NAME}. In terms of reverse engineering challenges, hidden flags are commonly obtained by analyzing the binary files.
Most of the reverse engineering challenges are about analyzing Linux or Windows executable files. However, sometimes we can see challenges involving other file formats. Therefore, what we should do first is to identify the file type by using the file command. Using this command we can reveal that the file is an eBPF program as follows:
root@6d1def7da3d3:~# file babyebpf.o
babyebpf.o: ELF 64-bit LSB relocatable, eBPF, version 1 (SYSV), not stripped
There are typically two approaches to solve this challenge:
- Run the eBPF program
- Understand the code within the file using reverse engineering techniques
We will take the latter approach this time for curiosity’s sake!
As we learned earlier, it is hard to analyze all the instructions in the binary file manually. Therefore, we usually use a conversion technique called disassembly, which is a technique to automate these conversions. Disassemble converts the machine code into a mnemonic: a mnemonic is a human-friendly text based instruction.
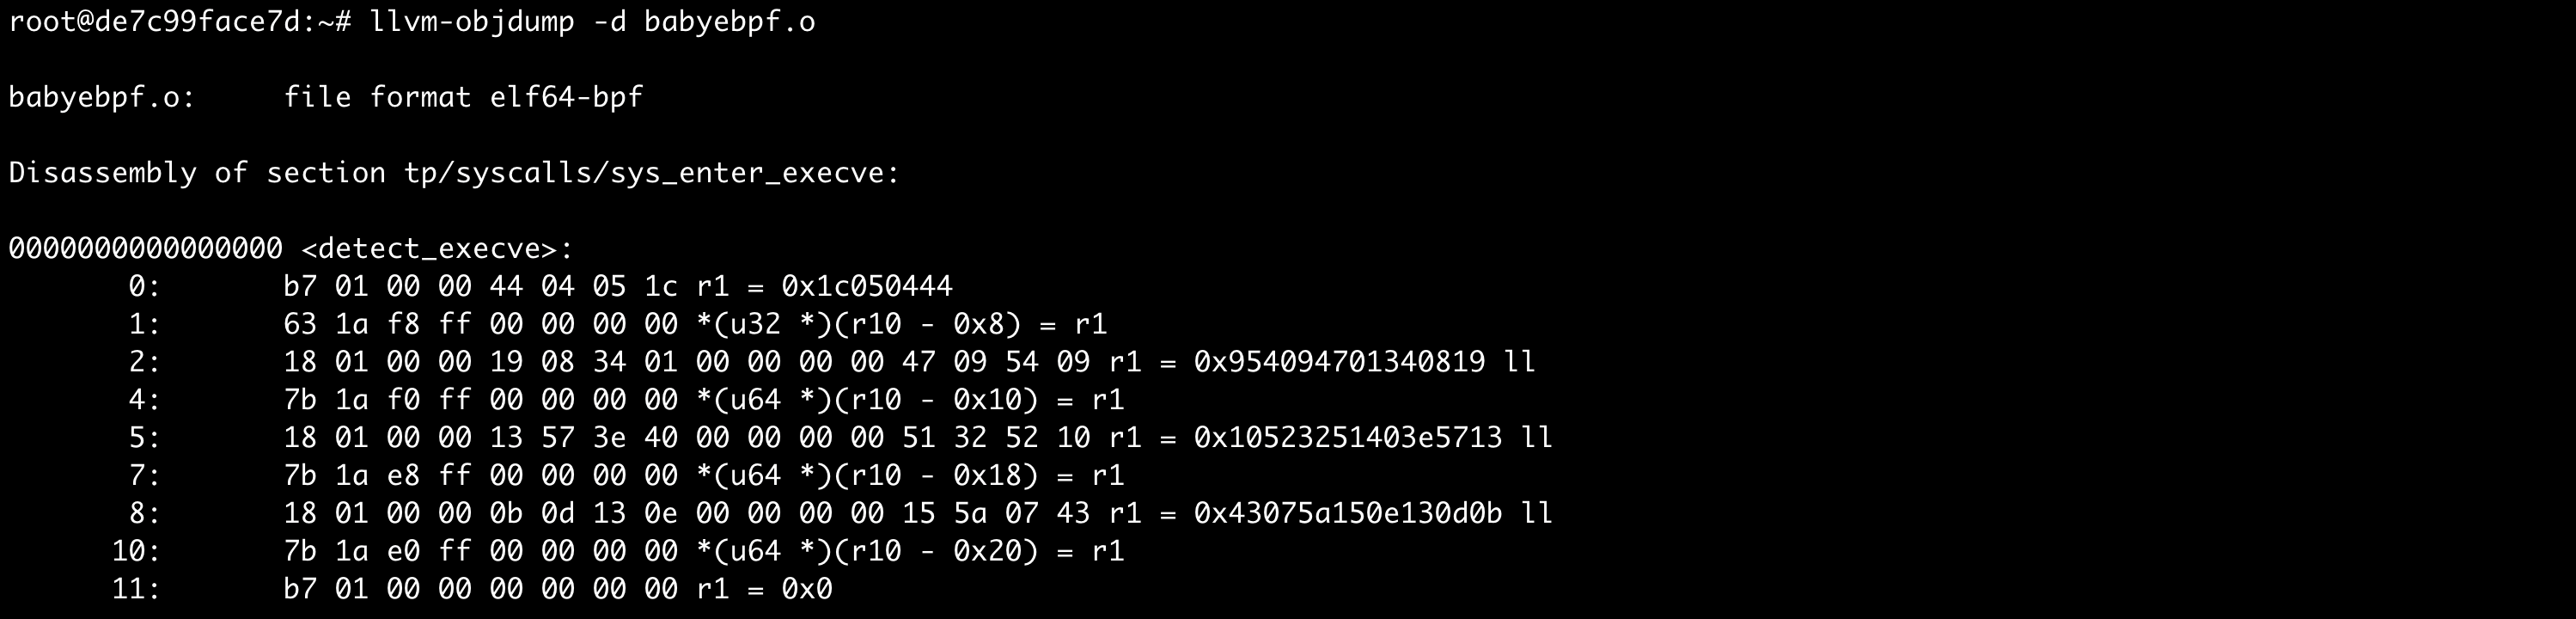
To disassemble the eBPF bytecode I recommend using the llvm-objdump command. With the -d option, we can disassemble the binary file. The command by default displays the original hexadecimal values along with the mnemonics, but the results would be too verbose. We can use the --no-show-raw-insn flag to hide the hexadecimal part and focus on just the mnemonic instructions.
root@6d1def7da3d3:~# llvm-objdump --no-show-raw-insn -d babyebpf.o

babyebpf.o: file format elf64-bpf

Disassembly of section tp/syscalls/sys_enter_execve:

0000000000000000 <detect_execve>:
       0:   r1 = 0x1c050444
       1:   *(u32 *)(r10 - 0x8) = r1
       2:   r1 = 0x954094701340819 ll
       4:   *(u64 *)(r10 - 0x10) = r1
       5:   r1 = 0x10523251403e5713 ll
       7:   *(u64 *)(r10 - 0x18) = r1
       8:   r1 = 0x43075a150e130d0b ll
      10:   *(u64 *)(r10 - 0x20) = r1
      11:   r1 = 0x0

0000000000000060 <LBB0_1>:
      12:   r2 = 0x0 ll
      14:   r2 += r1
      15:   r2 = *(u8 *)(r2 + 0x0)
      16:   r3 = r10
      17:   r3 += -0x20
      18:   r3 += r1
      19:   r4 = *(u8 *)(r3 + 0x0)
      20:   r2 ^= r4
      21:   *(u8 *)(r3 + 0x0) = r2
      22:   r1 += 0x1
      23:   if r1 == 0x1c goto +0x1 <LBB0_2>
      24:   goto -0xd <LBB0_1>

00000000000000c8 <LBB0_2>:
      25:   r3 = r10
      26:   r3 += -0x20
      27:   r1 = 0x1c ll
      29:   r2 = 0x4
      30:   call 0x6
      31:   r0 = 0x1
      32:   exit
I will briefly explain how to interpret the disassembled code. For example, to express an assignment of the value 10 to the r1 register, we use the notation r1 = 10. When assigning data to a location in memory we use a notation like *(u32*)(r10) = r1. In this example we take the value of the r10 register as an address, and the value of r1 is assigned to the memory pointed to by that address.
Let’s begin by looking at the detect_execve function.
0000000000000000 <detect_execve>:
       0:   r1 = 0x1c050444
       1:   *(u32 *)(r10 - 0x8) = r1
       2:   r1 = 0x954094701340819 ll
       4:   *(u64 *)(r10 - 0x10) = r1
       5:   r1 = 0x10523251403e5713 ll
       7:   *(u64 *)(r10 - 0x18) = r1
       8:   r1 = 0x43075a150e130d0b ll
      10:   *(u64 *)(r10 - 0x20) = r1
      11:   r1 = 0x0
This code assigns 0x1c050444, which is 470090820 in decimal, as an immediate value to the r1 register, then copies the value to the address pointed to by r10-8 in memory. Please note that the r10 register points to the address of the stack frame. Therefore, it means the code assigns the value to a local variable. We can also see similar code next line onwards. Finally, the r1 register is set to 0. The below figure shows the stack layout after these instructions were executed.

Let’s continue to read the disassembled code, and check the bottom of this function first.
0000000000000060 <LBB0_1>:
      12:   r2 = 0x0 ll
      14:   r2 += r1
      15:   r2 = *(u8 *)(r2 + 0x0)
      16:   r3 = r10
      17:   r3 += -0x20
      18:   r3 += r1
      19:   r4 = *(u8 *)(r3 + 0x0)
      20:   r2 ^= r4
      21:   *(u8 *)(r3 + 0x0) = r2
      22:   r1 += 0x1
      23:   if r1 == 0x1c goto +0x1 <LBB0_2>
      24:   goto -0xd <LBB0_1>
We can see an if statement, where the instruction compares the r1 register and 0x1c (28 in decimal). If they are equal, the program jumps to LBB0_2 label. If not, it goes back to the first line of the LBB0_1 label. Through this analysis we can reach the conclusion that these instructions are equivalent to loop statements of a high-level programming language. In fact, before the if statement, we can see the value stored in register r1 is incremented by 1. This shows that the program is using the r1 register as a loop counter.
Let’s read the code again, keeping in mind that there is a loop statement. First, the code assigns 0 to the r2 register, then adds the value of the r1 register to the r2 register. In the beginning, the r1 register is set to 0 as explained in the detect_execve function, so the r2 register will be 0 if it is added. Next, the code stores the data by dereferencing the address in the r2 register.
Let’s take a look at the r3 register. It is copied from the r10 register, which is the stack address. Then 32 is subtracted from the r3 register. 32 is equal to the exact offset from the address of the stack frame to the address of the local variable. Then, the address is added to the value in the r1 register, dereferencing the pointer, storing the data in the local variable to the r4 register. After that, the values stored in r2 and r4 registers are XOR’ed and the result is stored in the r2 register. Finally, the data pointing by the r3 register, which is the data of the local variable, is overwritten by the result.
After all of the above, the value of the r1 register is incremented by 1, and the if statement of the loop is evaluated. Therefore, we can conclude that the code block performs an XOR operation with two data points per byte, then overwrites the data in the local variable. Also, the r1 register is compared to 28, so we can guess that length of the data is expected to be 28 bytes.
But exactly what kind of data is stored in the r2 register? Since we cannot find out the data using only the disassembled code, we continue to investigate the binary file from a different perspective. Generally, binary files embed in themselves interesting strings. We can try to extract those strings with the strings command from GNU Binary Utilities.
root@6d1def7da3d3:~# strings -tx -a babyebpf.o
     5c G   T   {
    148 marinkitagawamarinkitagawama
    16e W>@Q2R
    179 G   T   D
    2a5 .text
    2ab detect_execve.____fmt
    2c1 _version
    2ca .llvm_addrsig
    2d8 detect_execve
    2e6 .reltp/syscalls/sys_enter_execve
    307 _license
    310 baby_ebpf.c
    31c .strtab
    324 .symtab
    32c .rodata
    334 LBB0_2
    33b LBB0_1
    342 .rodata.str1.1
According to the result, we found that there are some interesting strings. Based on the result about data length, marinkitagawamarinkitagawama is the most interesting string of all the strings because the data length is exactly 28 bytes:
root@6d1def7da3d3:~# echo -n marinkitagawamarinkitagawama | wc -c
28
Lastly, we will read the instructions on the LBB0_2 label.
00000000000000c8 <LBB0_2>:
      25:   r3 = r10
      26:   r3 += -0x20
      27:   r1 = 0x1c ll
      29:   r2 = 0x4
      30:   call 0x6
      31:   r0 = 0x1
      32:   exit
In this code block, we should pay attention to the call instruction. The call instruction can execute functions that are local to the eBPF program, but it can also execute functions specified by an integer argument. The mapping between those functions and integer values is defined in the Linux source code; 6 looks like the trace_printk function. Therefore, we get the idea that this code intends to print something. The code also stores the address of the local variable to the r3 register as the third function argument. This allows us to guess that this eBPF program is going to display the XOR encoded or decoded data pointed by the value in the r3 register.
Capturing the Flag
Let’s create a script to emulate the decoding algorithm in order to solve this challenge by what we’ve learned. I usually use the Ruby programming language to solve CTF challenges and below is my solution for this challenge. Any programming language is ok, so feel free to write the script in a programming language of your choice.
#!/usr/bin/env ruby
encoded = [
    0x43075a150e130d0b,
    0x10523251403e5713,
    0x954094701340819,
    0x1c050444
].pack('Q*').chars
key = "marinkitagawamarinkitagawama".chars

key.zip(encoded) do |k, e|
  print (k.ord ^ e.ord).chr
end
The above Ruby script displays the data conducted XOR operation with the value of the local variable assigned and the embedded value in the binary file per byte.
By running this script, we could extract the following flag.
root@6d1def7da3d3:~# ruby solve.rb
flag{1n7r0_70_3bpf_h3h3h3eh}
Conclusion
In this blog, I explained the internals of eBPF along with a reverse engineering challenge. I’m sure there are many people using eBPF indirectly without really realizing it. However, there aren’t many who know about the internal details in depth. While the opportunity to use this knowledge may not come up often, it is still a great skill set to have under your belt when you need to debug and investigate problems at a lower level.
Thank you for reading! I hope this blog will help you.